Tips & Tricks
Relation between Bulk Modulus K, Shear Modulus G, Young's Modulus E and Poisson's ratio ν
This tip explains the relations between the parameters that describe the linear elastic behavior of materials
Jürgen
Rueckert
Virtual Performance
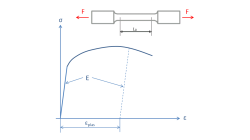
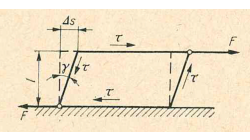
How to convert force-deflection into true stress-strain curves?
This tip helps to convert typical tensile test data into stress-strain curves to be used in many material models of Virtual Performance Solution (VPS)
Jürgen
Rueckert
Virtual Performance
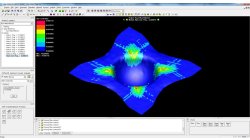
Fiber volume content contour
Two dedicated composites contours are available in PAM-FORM 2G post-processing: Shear angle and fiber directions.
Mathilde
Chabin
Composites
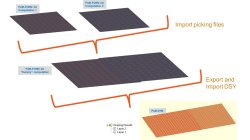
Coupling between PAM-FORM and PAM-RTM: multiple part mapping
Coupling between PAM-FORM 2G and PAM-RTM is done through a .DSY file. Thus, pre-forming process is simulated with PAM-FORM 2G and resulting fiber orientations that will affect permeabilities are transferred to PAM-RTM model setup.
Mathilde
Chabin
Composites
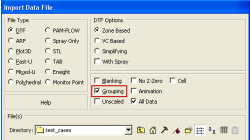
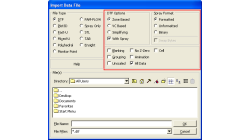
Grouping option for CFD-VIEW Data Import
Grouping feature in CFD-ACE+ GUI and CFD-VIEW comes in handy when working with complex industrial models. This feature allows putting BC patches or VC entities into a group that can be manipulated easily, to either set up properties or display specific post-processing attributes.
Abraham
Meganathan
CFD

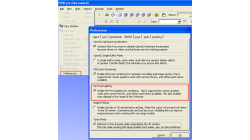
CFD-VIEW Scripting is easier than ever with Journaling
In addition to the numerous options and tools available via the CFD-VIEW user interface, the scripting capability of CFD-VIEW allows you to perform complex data processing on your simulation results, and gives you the option to run the post-processing phase of your simulation in batch mode.
Abraham
Meganathan
CFD
CFD-VIEW: Working with cell-center data in batch mode
Many improvements have been made in CFD-VIEW that allows the manipulation of cell-center data. The latest cell-center data additions implemented in CFD-VIEW V2011.0 include, for example, support for the MinMax Probe and the Calculator.
Abraham
Meganathan
CFD
"Per Pixel Lighting" display option in CFD-VIEW
When visualizing CFD solutions, it is often of interest to see a particular range of variable values, and it is therefore useful to be able to clip the surface coloring to that range, as to obtain a clearer view of the areas affected by the variable.
Abraham
Meganathan
CFD
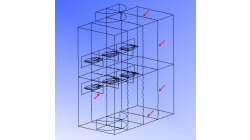
Visualizing decomposed model without zonal interface outlines
Running a simulation in parallel allows quicker turn around for larger and complex problems. Such parallel jobs require the computational domain to be decomposed into multiple zones. Such a multiple-zone file may be inconvenient to post-process in CFD-VIEW because zonal interface outlines will be visible and the original surfaces would have been split. As depicted in figure 1 below, these outlines can be numerous and may therefore hinder the clarity of the model.
Abraham
Meganathan
CFD

Visualizing particle size effect on Spray particle trajectory
When analyzing flow vectors, one can get a general trend of the direction of the flow and locations of recirculation. But what if you need to specifically know where a particle will end up? Maybe release points need to be studied. Then, the size and mass can make a difference in the path a particle travels.
Abraham
Meganathan
CFD