- Home
- Resources
- Tips & Tricks
Tips & Tricks
Visual Display of Bad Cells in CFD-VisCART
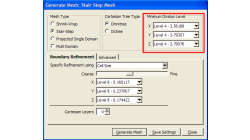
Most models have certain parts or regions where the grid density needs to be higher than other areas to accommodate for steep curvatures, sharply changing topology, etc.
Abraham
Meganathan
CFD
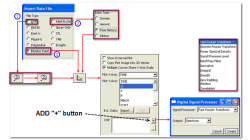
Digital Signal Processing using CFD-VIEW
Signals (stream of data) obtained from physical or numerical experiments often require additional processing to understand/interpret the physics they represent. The processing of signals through digital means is termed Digital Signal Processing (DSP).
Abraham
Meganathan
CFD
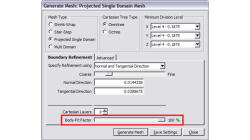
Using Local and Global Body Fit Factors in CFD-VisCART
The 'Body-fit Factor' is a percentage value used to determine how closely the Cartesian mesh front faces are projected to the real geometric surfaces. In other words, the Body-fit factor controls grid quality versus geometric fidelity. The value is between 0% and 100%, where 0%means no projection and 100% means complete projection to the surface.
Abraham
Meganathan
CFD
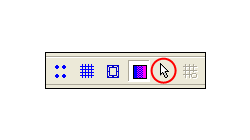
Surface facet selection tool in CFD-VisCART
CFD-VisCART has always allowed surface selection where any surface can be selected by clicking on the graphics area or in the explorer window. Additionally, there is Facet Selection tool that allows the user to select individual facets or triangles of a surface (each surface is composed of triangulated faces called facets).
Abraham
Meganathan
CFD
Plotting Multiple Variables in the CFD-VIEW Plotter
Plotting two or more variables on same plot having values of different magnitude/scale becomes difficult or many times impossible. In these cases plotting data with multiple Y-axes becomes very useful and sometimes necessary.
Abraham
Meganathan
CFD
Integer Cell Size Specification in CFD-VisCART
As it was explained in a previous tip called Understanding cell-splitting in CFD-VisCART and its effect on cell count, a small change in a specified cell size could lead to drastic changes in the cell count due to the cell-splitting rules used by CFD-VisCART.
Abraham
Meganathan
CFD
Importing external data in the CFD-VIEW Plotter
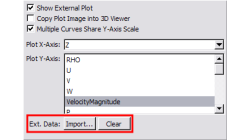
Comparing computational results to experimental data is a task often asked of CFD analysts and engineers. The line/curve plotter in CFD-VIEW is commonly used for plotting computational results along curves, such as line probes, surface slices, time histories, etc. CFD-VIEW offers a feature that allows users to import experimental or other external data in the same plot, thus making it easy to compare results.
Abraham
Meganathan
CFD
Fit to View in CFD-VisCART
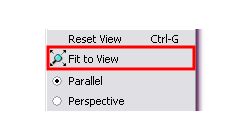
In CFD-VisCART, the 'Fit to View' function was improved in V2007. It now checks the blanking status before setting the view. In this tip, a car model will be used to demonstrate the Fit to View capability.
Abraham
Meganathan
CFD
Coloring Surfaces in CFD-VisCART for Better Model Visualization
A typical model imported into CFD-VisCART may contain a number of parts and surfaces. By default, all surfaces come in with the default color (set under Edit → Preferences → Colors → Geometry Colors → Surfaces). Representing these surfaces with different colors would improve the appearance of the model and make it easier for the user to distinguish one surface (or part) from the other.
Abraham
Meganathan
CFD
CFD-VisCART 'Save Image' feature
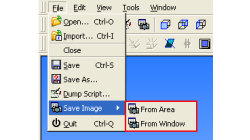
As in CFD-VIEW, CFD-VisCART has a 'Save image' feature that allows you to save snapshots of you model. If you are interested in this tip, please read on.
Abraham
Meganathan
CFD
