Tips & Tricks
Visualizing decomposed model without zonal interface outlines
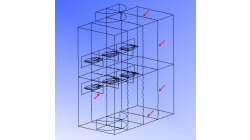
Running a simulation in parallel allows quicker turn around for larger and complex problems. Such parallel jobs require the computational domain to be decomposed into multiple zones. Such a multiple-zone file may be inconvenient to post-process in CFD-VIEW because zonal interface outlines will be visible and the original surfaces would have been split. As depicted in figure 1 below, these outlines can be numerous and may therefore hinder the clarity of the model.
Abraham
Meganathan
CFD

Visualizing particle size effect on Spray particle trajectory
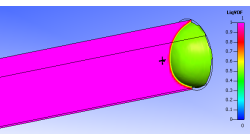
When analyzing flow vectors, one can get a general trend of the direction of the flow and locations of recirculation. But what if you need to specifically know where a particle will end up? Maybe release points need to be studied. Then, the size and mass can make a difference in the path a particle travels.
Abraham
Meganathan
CFD
Using Macros in CFD-VIEW
In some cases, you might have to perform the same task several times to post-process your results in CFD-VIEW. This can happen for example when you are running a parametric study and need to extract the same information from all the solution files. In this case, it might be time-saving to use the Macro option of CFD-VIEW, especially if obtaining the information necessitates many operations.
Abraham
Meganathan
CFD
Using CFD-VIEW Scripting for transient simulations post-processing
With the Python scripting capabilities of CFD-VIEW, you can quickly and easily perform the repetitive tasks you encounter when post-processing transient simulations.
Abraham
Meganathan
CFD
CFD-VIEW: Save Smaller mdl Files
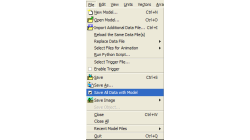
While working with CFD-VIEW, the user has the option of saving an mdl file. This file stores all the entities created in CFD-VIEW, from the point the DTF file (or other data file) was imported, to their current state at the time of saving. The user can thus reopen this file anytime later to resume work.
Abraham
Meganathan
CFD
Plotter Operations with CFD-VIEW
The Plotter operator in CFD-VIEW supports signal processing for Time History data. A previous user tip – Digital Signal Processing using CFD-VIEW – shows how time history date can be made available and how to perform a PSD on a periodic signal. The aim of this new user tip is to list all options supported by the Plotter Operator.
Abraham
Meganathan
CFD
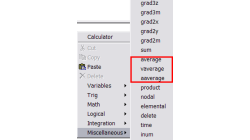
Getting Average Quantities in CFD-VIEW
Many times, post-processing results requires computing average quantities of variables over a surface or volume. CFD-VIEW makes it easy with three calculator functions under the ‘Miscellaneous’ function category, as shown in Figure 1.
Abraham
Meganathan
CFD
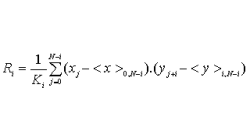
Digital Signal Processing using CFD-VIEW
Signals (stream of data) obtained from physical or numerical experiments often require additional processing to understand/interpret the physics they represent. The processing of signals through digital means is termed Digital Signal Processing (DSP).
Abraham
Meganathan
CFD
Plotting Multiple Variables in the CFD-VIEW Plotter
Plotting two or more variables on same plot having values of different magnitude/scale becomes difficult or many times impossible. In these cases plotting data with multiple Y-axes becomes very useful and sometimes necessary.
Abraham
Meganathan
CFD
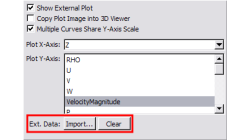
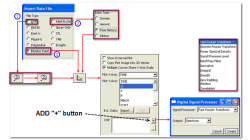
Importing external data in the CFD-VIEW Plotter
Comparing computational results to experimental data is a task often asked of CFD analysts and engineers. The line/curve plotter in CFD-VIEW is commonly used for plotting computational results along curves, such as line probes, surface slices, time histories, etc. CFD-VIEW offers a feature that allows users to import experimental or other external data in the same plot, thus making it easy to compare results.
Abraham
Meganathan
CFD